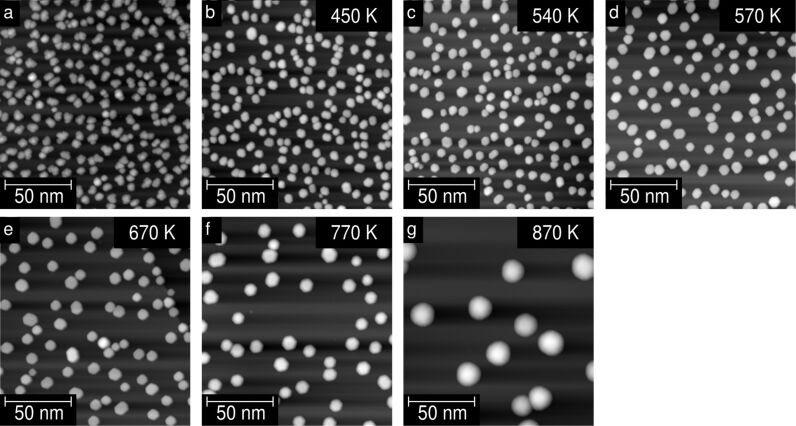
Figure 4.
Temperature dependence of the annealing behaviour of the Ni clusters. STM topographic images of the HOPG sample (a) after deposition of Ni on the cold sample and (b–g) after the different annealing steps. Annealing was performed stepwise, starting at T ≈ 450 K (b) up to T ≈ 870 K (g). All data were obtained at V = 1.0 V with a tunnelling current of I = 0.2 nA in consistency with Figure 1.

