
Fig. 1.
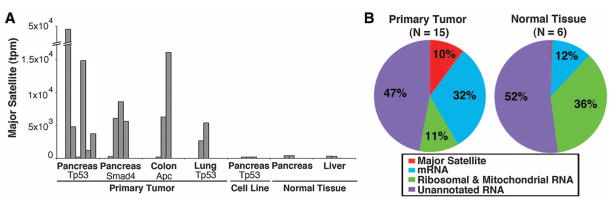
Massive expression of major satellites in mouse pancreatic tumors. (A) Expression of major satellite in primary tumors, cell lines, and normal tissues, presented as transcripts per million of aligned genomic reads. All tumors and cell lines have KrasG12D; deleted genes are listed individually (Tp53, Smad4, and Apc). (B) Graphical representation of sequence read contributions from major satellites, averaged among all primary tumors versus normal tissues (pancreas and liver). “Unannotated RNA” indicates reads that aligned to the mouse genome, but not to the mouse reference transcriptome.