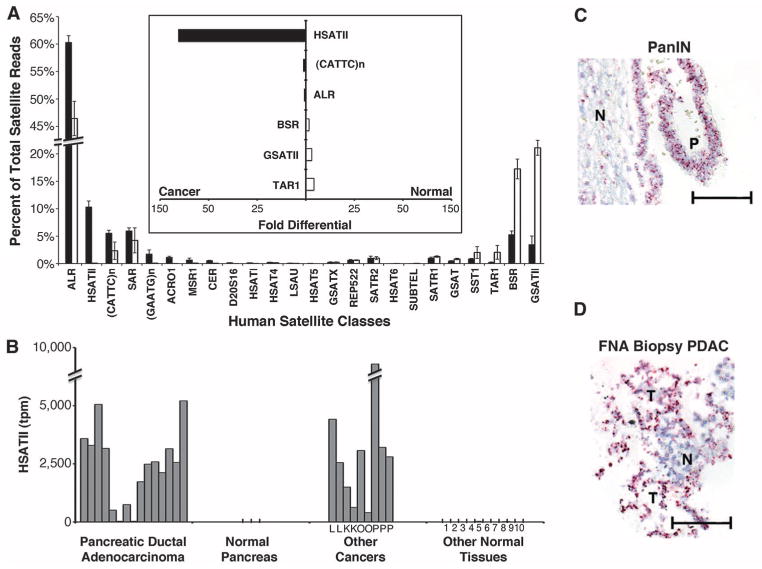
Fig. 3.
Overexpression of satellites in human cancers. (A) Breakdown of satellite classes as a percentage of total satellites in human PDAC (black, n = 15) and normal human tissues (white, n = 12). Satellites are ordered from highest in tumors to highest in normal tissue (left to right). Error bars represent SEM. Inset (bar graph, center) shows the differential expression of selected satellite classes enriched in cancer (left, black bars) or normal tissue (right, white bars). (B) HSATII expression in human PDAC, normal pancreas, other cancers (L, lung; K, kidney; O, ovarian; P, prostate), and normal human tissues (1, fetal brain; 2, adult brain; 3, colon; 4, fetal liver; 5, adult liver; 6, lung; 7, kidney; 8, placenta; 9, prostate; and 10, uterus) quantitated by DGE. Satellite expression is shown as transcripts per million (tpm) aligned to human genome. (C and D) RNA-ISH with HSATII probe (red stain): (C) human PanIN (P) and normal adjacent tissue (N). (D) EUS-FNA biopsy of confirmed tumor (T) and normal adjacent tissue (N). All images are at 200× magnification (scale bar, 100 μm).

