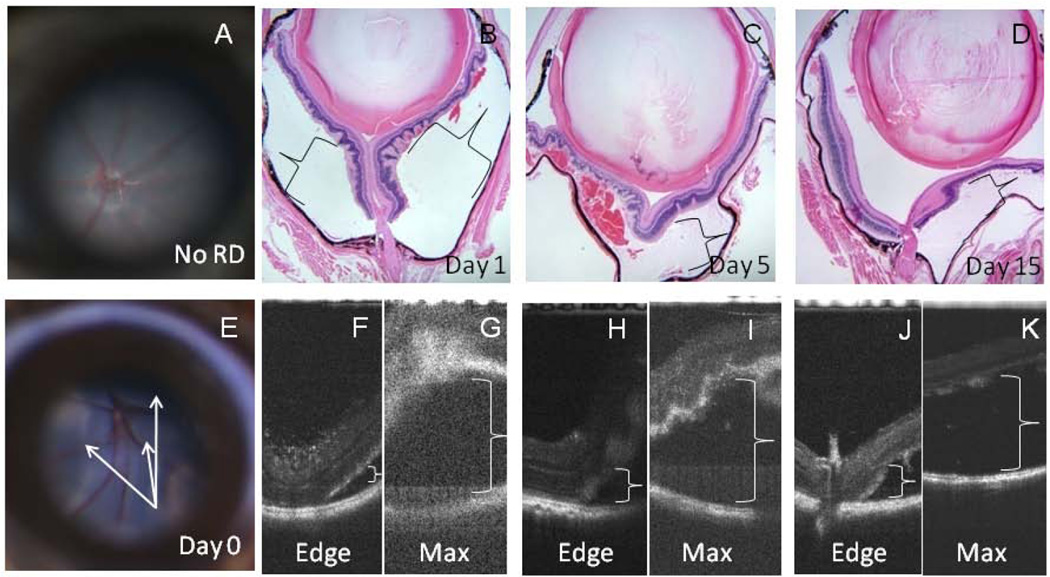
Figure 1.
RDs were confirmed by microscopy in all mice. Representative fundus photographs of a mouse with no RD (A) and day 0 RD (E) are shown. H&E sections are shown with representative histopathology of RDs 1, 5, and 16 days duration (B–D,×40 magnification). Corresponding SD-OCT images taken prior to the enucleation of each animal are shown (day 1 (F, G), day5 (H, I), day 16 (J, K)). Areas corresponding to the edge (F, H, J) and maximal height ( G, I, K) of the RD at each timepoint are shown. Retinal layers appeared indistinct soon after RD (day 1 (B, F, G)), particularly over areas of maximal detachment (G). Detached areas are denoted with brackets. The detached retina at day 16 (D, K) appears thinner than day 1 (B, G) or day 5 retina (C, I).

