Figure 1.

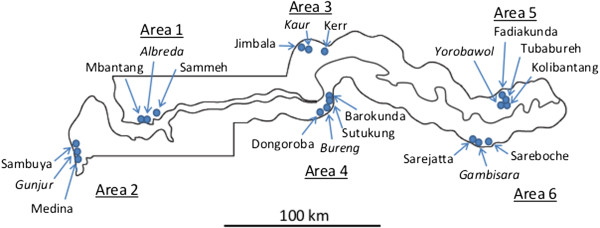
Map of The Gambia showing the six areas and 20 study villages samples in the wet season (September to November) of 2008 and dry season (March to May) of 2009. The villages which have health centres are shown in italics.

Map of The Gambia showing the six areas and 20 study villages samples in the wet season (September to November) of 2008 and dry season (March to May) of 2009. The villages which have health centres are shown in italics.