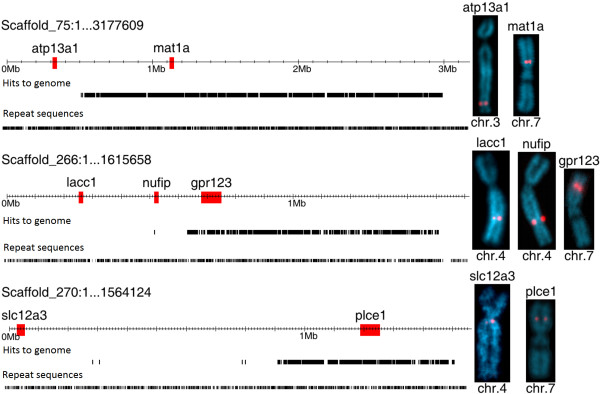
Figure 3.

FISH-TSA analysis of three hybrid scaffolds. Selected genes from read-rich and read-absent areas of v4.1 scaffolds_75, _266, and _270 were physically mapped to X. tropicalis chromosomes using specific cDNA probes. Top line shows probe gene location on scaffold, second line shows distribution of uniquely-mapping reads, third line shows distribution of repetitive sequence (similar in hit-rich and hit-absent areas).
