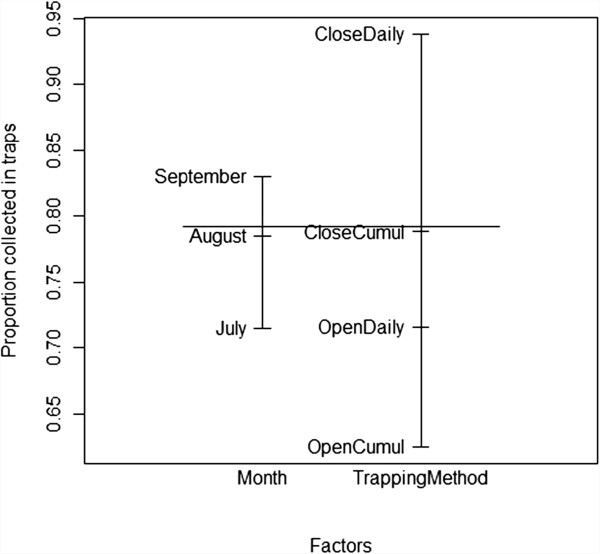
Figure 5.
Proportion of mosquitoes collected in traps, ranging from 0 to 1 (Y axis) in Soumousso (low vector density area). Explanatory variables are shown on the X axis. The bars inserted inside indicate the main effects of the two explanatory variables, drawing attention to the major differences between the trapping methods and the small differences between the months. i) OpenDaily for open doors with a daily collection of alive and dead mosquitoes in both houses and traps, ii) CloseDaily for closed doors with a daily collection of alive and dead mosquitoes in both houses and traps, iii) OpenCumul for open doors with collection of alive mosquitoes done in the traps the last day of the survey, however alive and dead mosquitoes were daily collected in corresponding houses, and iv) CloseCumul for closed doors with collection of alive mosquitoes done in the traps the last day of the survey, however alive and dead mosquitoes were daily collected in corresponding houses.

