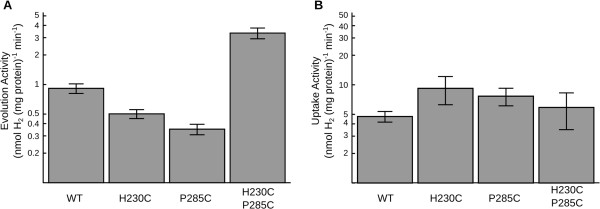
Figure 3.

Hydrogen evolution (A) and uptake (B) activities for lysates of E. coli strain FTD147 over-expressing wild type A. macleodii hydrogenase or substitutions H230C, P285C, and H230C/P285C. Activities on both graphs are plotted on matching log scales over a 50-fold range to allow comparison of equivalent fold-changes. Error bars represent one standard error of the mean.
