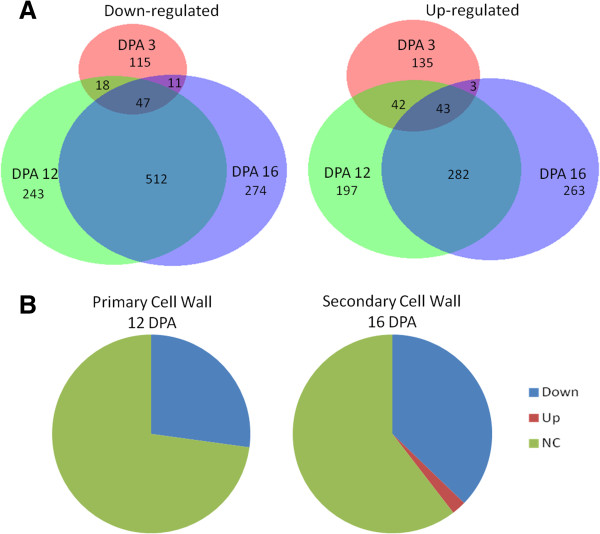
Figure 2.
Results of the microarray analysis comparing Li1 and its WT NIL in DP5690 background. A) The distribution and number of probe sets from the microarray showing altered regulated by >2 fold in Li1. B) Pie diagram illustrating the relative percentages of probe sets showing altered regulation in the Li1 mutant that were identified as primary cell wall related in 12 DPA fiber samples and secondary cell wall related in 16 DPA fibers.

