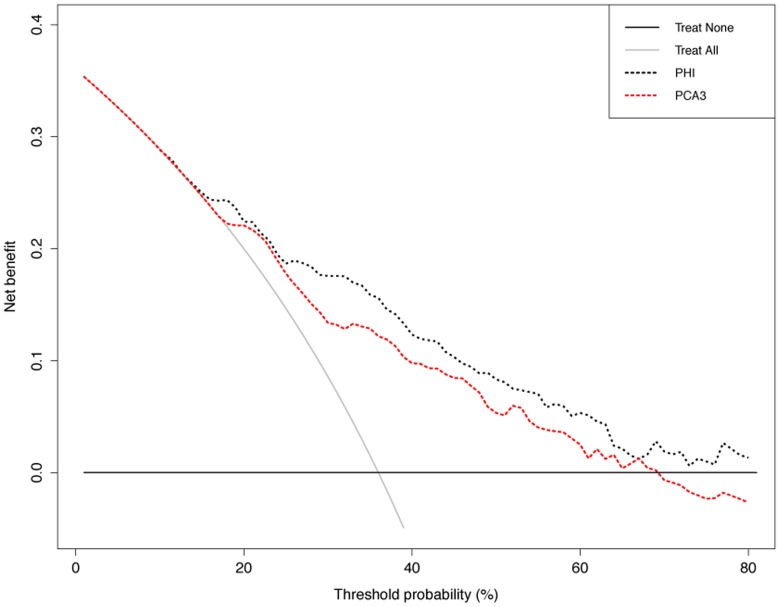
Figure 2. Decision curve analysis.
The net benefit (calculated by subtracting the proportions of false positive from the proportion of true positive, the former being weighted by the relative harms of false positive and false negative results) of both phi and PCA3 is plotted against the threshold probability (the probability of PCa at which the benefits of opting for biopsy or no biopsy are considered equal). Solid lines represent the net benefit associated to the benchmarking strategies of biopsying all or no men irrespective of any diagnostic tool.

