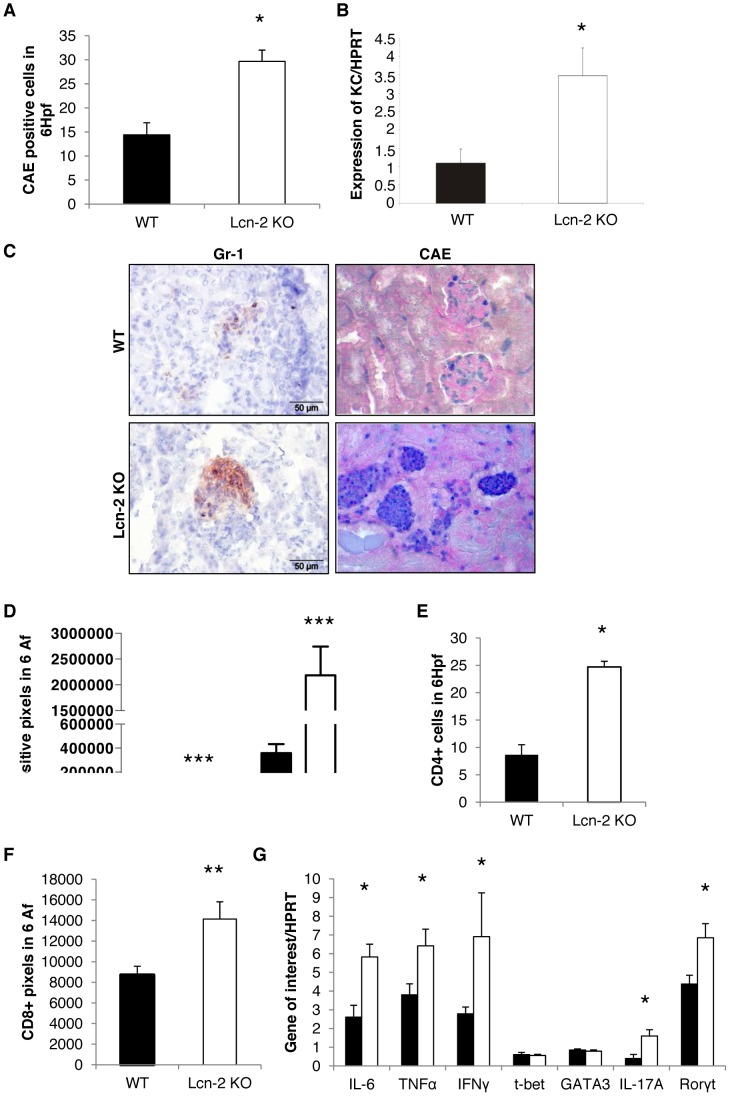
Figure 3. Lcn-2 KO mice display increased inflammatory cell infiltration of kidneys after NTS.
WT (black bar; n = 13) and Lcn-2 KO mice (white bar; n = 12) were subjected to NTS. (A) Seven days after induction of NTS kidney sections were evaluated for the infiltration of CAE+ cells. The number of positive cells in 6 high power fields is given. (B) cDNA isolated from kidney samples was analysed for the KC expression. The relative abundance of KC to the house-keeping gene HPRT is provided. (C) Representative pictures of kidneys stained for Gr-1+ (left column) and CAE+ (right column) cells are given. The CAE+ cells are stained in dark blue, the Gr-1+ cells in brown. Kidney sections were analyzed for Gr-1 and CD68 (D), CD4 (E), and CD8 (F). (G) cDNA isolated from kidney samples was analyzed for the expression of the respective genes. The fold increase compared to healthy controls is provided. All data are given as mean ± SEM. Af = analysis field. Hpf = high power field. *p<0.05, **p<0.01, and ***p<0.001.

