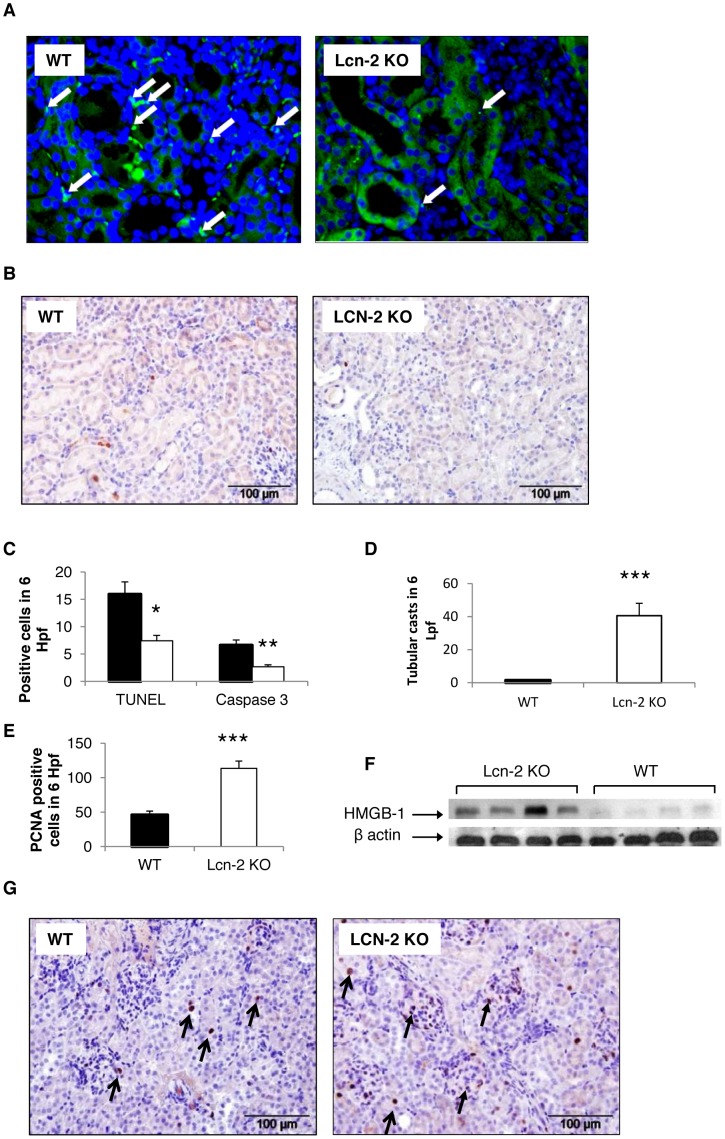
Figure 4. Lcn-2 KO show decreased apoptosis but increased proliferation in NTS.
WT (black bar; n = 13) and Lcn-2 KO mice (white bar; n = 12) were subjected to NTS. Seven days after induction of NTS kidney sections were (A) TUNEL stained and stained for (B) active Caspase-3. Apoptotic cells are marked with arrows. (C) The number of TUNEL and active Caspase-3 positive cells was quantified. Furthermore, sections were (D) H&E stained and evaluated for tubular necrosis. (E+G) Additionally, kidneys of WT and Lcn-2 KO mice were evaluated for proliferating cells 7 days after NTS induction by performing PCNA stainings. (E) Quantification and (G) representative pictures are shown._Magnification x400. Open arrows show representative PCNA-positive tubular epithelial cells. Closed arrows reflect representative PCNA-positive infiltrating immune cells. (F) Protein isolated from kidneys of Lcn-2 KO and WT mice was analyzed for HMGB-1 by Western blotting. Beta-actin reblotting was performed as a loading control. One representative blot is shown. All data are given as means ± SEM. Hpf = high power field. Lpf = low power field. *p<0.05, **p<0.01 and ***p<0.001.

