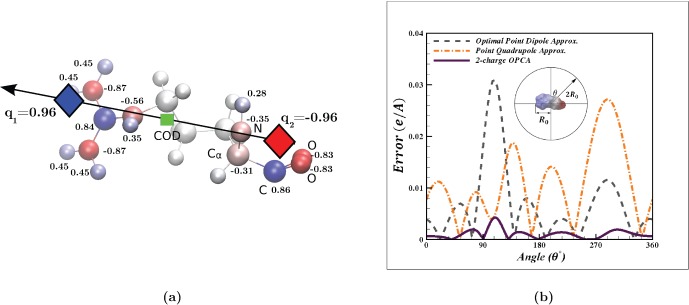
Figure 1. Example of a 2-charge optimal point charge approximation (OPCA).
For a sample charge distribution–a neutral amino acid (C-terminal arginine at physiological pH), including the associated NH-CH-COO backbone atom. (a) The green square represents the center of dipole (COD), with dipole moment  shown by the arrow. The two diamonds represent the two point charges,
  and
and  , of the OPCA. The atomic partial charges are represented as spheres rendered using VMD [21]. The sphere colors range from red to blue representing the charge range of
  to
to  , where
  is the atomic unit of charge. The charge values for partial charges
  are shown next to the atoms. As a visual reference, the backbone heavy atoms are labeled and covalent bonds are included in the figure. (b) Error in electrostatic potential for the 2-charge OPCA, point dipole, and point quadrupole with center of dipole as the expansion center. The error is calculated relative to the exact computation, on a circle at a distance
  , in the plane shown. Here,
  is the size of the charge distribution defined as the distance from its center of geometry to the outermost charge. The inset image shows the electrostatic surface potential rendered using GEM [22].

