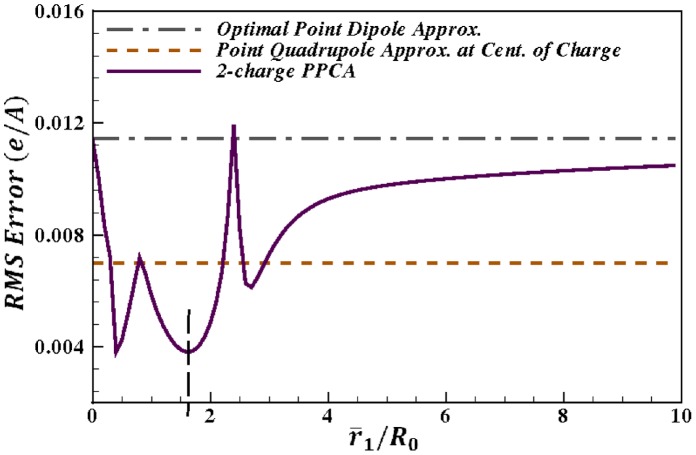
Figure 4. Accuracy of the 2-charge practical point charge approximation (PPCA) as a function of the distance  from the center of charge.
For the sample charge distribution shown in figure 3. Accuracy is calculated as the RMS error, relative to the exact computation, at a distance of  , where
  is the maximum extent of the charge distribution from the center of geometry. The point dipole and point quadrupole approximations with center of charge as the center of expansion are shown for comparison. The vertical dashed line represents the value
  that produces the lowest RMS error for the 2-charge PPCA in this case. Connecting lines are shown to guide the eye.

