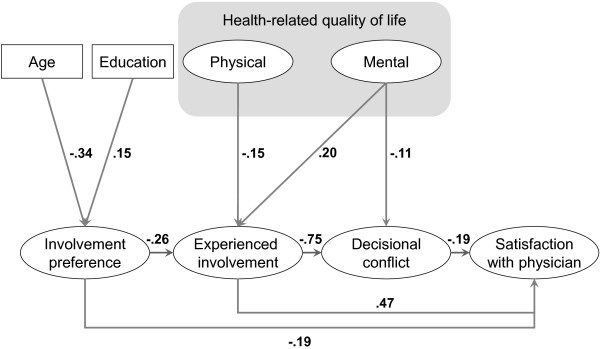
Figure 2.

Path model in the developmental sample; displayed numbers are standardised regression coefficients; 0.1 = small effect, 0.3 = medium effect, 0.5 strong effect.

Path model in the developmental sample; displayed numbers are standardised regression coefficients; 0.1 = small effect, 0.3 = medium effect, 0.5 strong effect.