
Figure 3. Gene expression analysis of Wnt signalling in monolayer (Mono) and anoikis resistant (AR) cells of normal breast cell lines (N), ER-ve and ER+ve breast cancer cell lines.
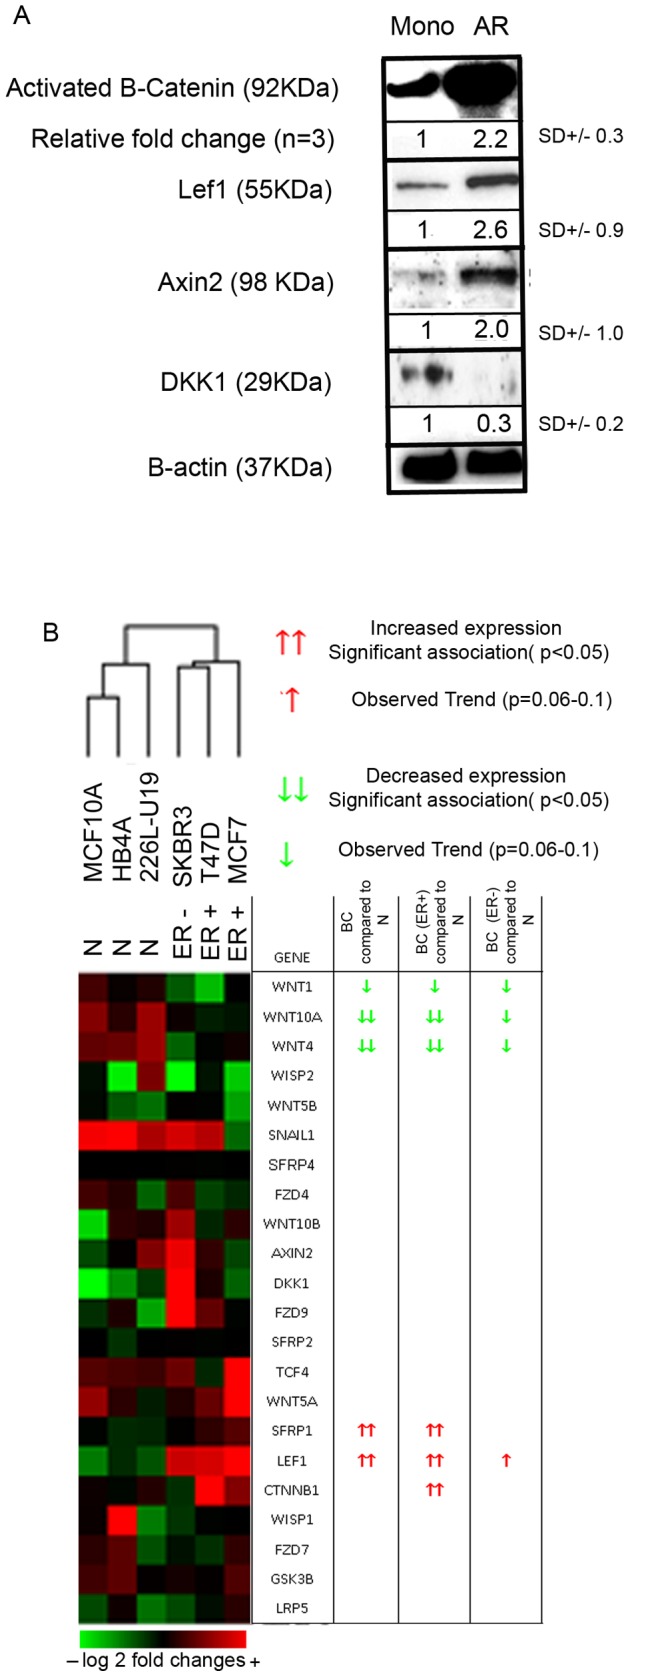
A) Protein expression of activated B-catenin (unphosphorylated), Lef1, Axin2, DKK1 and B-actin (housekeeper) in MCF7 monolayer and AR cells. B) Cluster analysis was performed using the fold change in expression between Mono and AR cells. Data is displayed in a heatmap represented by either decreased (green) or increased (red) expression compared to the mean mRNA expression. (Red) ↑↑ Indicates significant increased expression (<0.05) (red) ↑ indicates a trend towards increased expression. (Green) Indicates significant increased expression (<0.05) (green) indicated a trend towards increased expression.