
Figure 5.
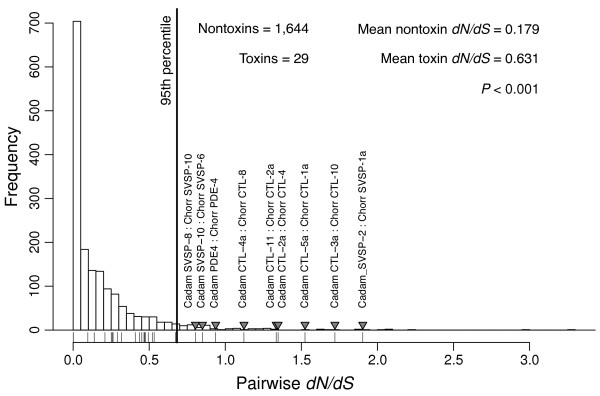
The distribution of pairwisedN/dS ratios for toxins compared to nontoxins. The histogram shows the null distribution of dN/dS for pairs of nontoxin orthologs identified by means of a reciprocal blast search. The vertical line denotes the cutoff for the 95th percentile for the nontoxins. The dN/dS values for the toxins are plotted below the histogram, and those toxin comparisons with values exceeding the 95th percentile for nontoxins are indictated with triangles and labeled with the names of the two sequences compared. We only expected 1.45 toxins to exceed this threshold if the distributions were the same for toxins and nontoxins. The P value is based on a Wilcoxon rank sum test and shows that the average dN/dS is significantly different between toxins and nontoxins. Comparisons with dS>0.1 were excluded. We also excluded comparisons with dS<0.001 to avoid inaccurately large dN/dS estimates.