
Figure 7.
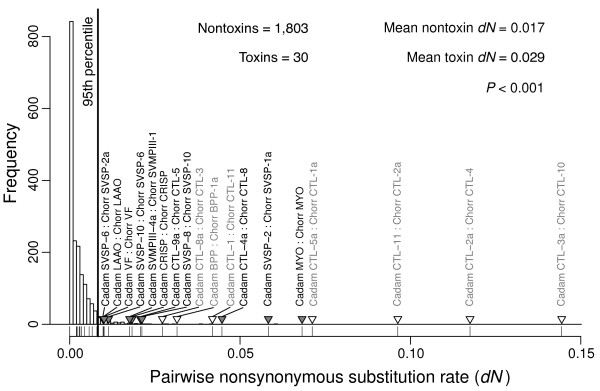
The distribution of pairwise nonsynonymous divergence ( dN ) for toxins compared to nontoxins showed an excess of outliers for toxins. The histogram shows the null distribution of dN for pairs of nontoxin orthologs identified by means of a reciprocal blast search. The vertical line denotes the cutoff for the 95th percentile for the nontoxins. The dN values for the toxins are plotted below the histogram, and those toxin comparisons with values exceeding the 95th percentile for nontoxins are indictated with triangles and labeled with the names of the two sequences compared. The P value is based on a Wilcoxon rank sum test and shows a significant difference in the mean dN between toxins and nontoxins. Comparisons with dS>0.1 were excluded, and those comparisons that also exceeded the synonymous divergence threshold (Figure 7) are labeled with white triangles instead of grey. Excluding the dS outliers, we found that almost half of the toxin comparisons exceeded the threshold established by the nontoxins, rather than the expected 5%.