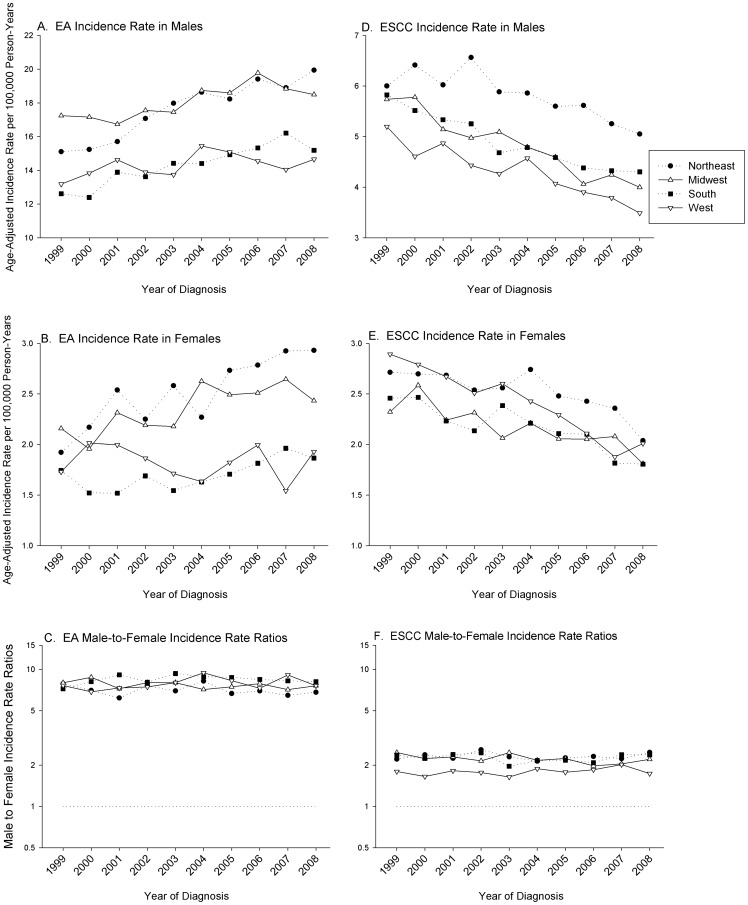
Figure 2. Age-adjusted incidence rates stratified by histology, sex, and region in whites, aged 45–84, 1999–2008.
Panel A and B illustrate the age-adjusted incidence rate per 100,000 person-years by census region of the histologic subtype EA in men and women, respectively. Panel C shows the male-to-female incidence rate ratio (IRRs) of EA by calendar year. Panel D and E depicts the age-adjusted incidence rate of ESCC in men and women, respectively. Panel F shows the male-to-female incidence rate ratio (IRRs) of ESCC by calendar year. Rates graphed are per 100,000 person-years.

