
Figure 2. Caspase-3 accumulates post-proteasome inhibition in LF82 BMDCs.
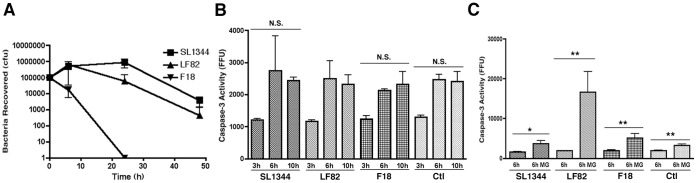
(A) Recovery of bacteria post intracellular survival and growth in BMDCs. After infection of BMDCs at an MOI of 100, bacteria were recovered and counted over 48 hpi. Intracellular growth curves were repeated at least three times in triplicate and data from a representative experiment is shown. (B) Caspase-3 activity in BMDCs at 3, 6 and 10 hpi. Caspase-3 activity was measured for the first 10 hpi and expressed as activity per mg of protein recovered. Caspase-3 activity assays were repeated at least three times in triplicate and data from a representative experiment is shown. No significant difference was noted between LF82 infected and any of the other infected or uninfected control cells. (C) Accumulation of caspase-3 activity in BMDCs after proteasome inhibition from 0–6 hpi. Caspase-3 activity in BMDCs was measured at 6 hpi and expressed as activity, measured in fluorescence focus units (FFU) per mg of protein. Measurements were carried out in the presence or absence of 10 µM MG132. All experiments were repeated at least three times in triplicate and data from a representative experiment is shown. Data was analyzed by an unpaired Student’s t-test. Statistically significant relationships are denoted. NS = Not significant. P values *<0.01, **<0.05.