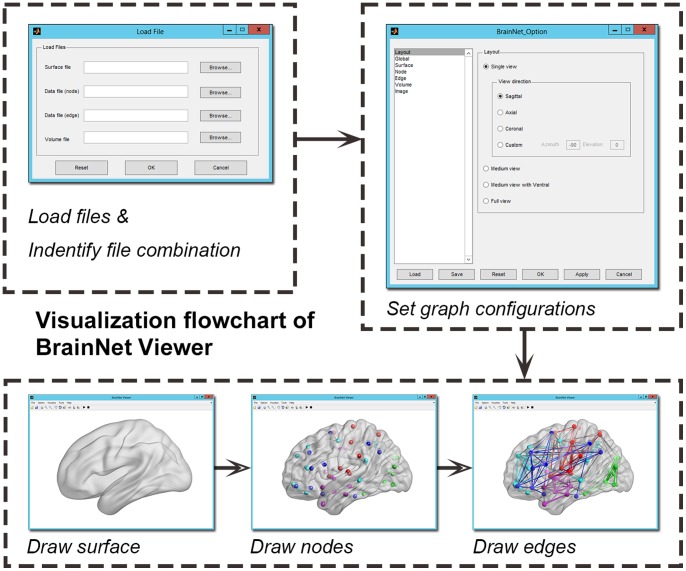
Figure 2. A flowchart for visualization of BrainNet Viewer.
First, the combination of the files containing connectome information is loaded. Then, the configuration of the graph is adjusted in an easy-to-use option panel. Next, BrainNet Viewer draws the brain surface, nodes and edges in sequence. Finally, the figure is saved in a common image format for further use.

