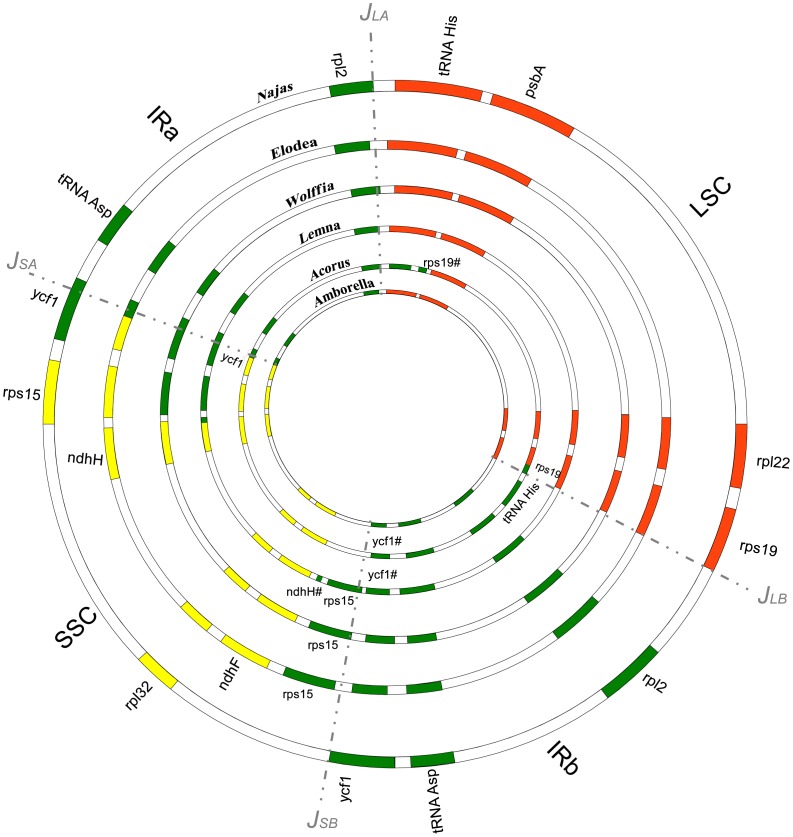
Figure 3. Comparison of expansion and contraction patterns that lead to junction changes between the IR and single copy regions (JLA, JSA, JSB, JLB).
The chloroplast genome of Najas flexilis is compared to those available for Alismatales, Acorus, sister to all other monocots, and Amborella, sister to all other angiosperms. Genes involved in IR expansions are color-coded. Green, genes in the IR regions; orange, LSC; and yellow, SSC. Dashed lines indicate the expected junction area. #, truncated gene.

