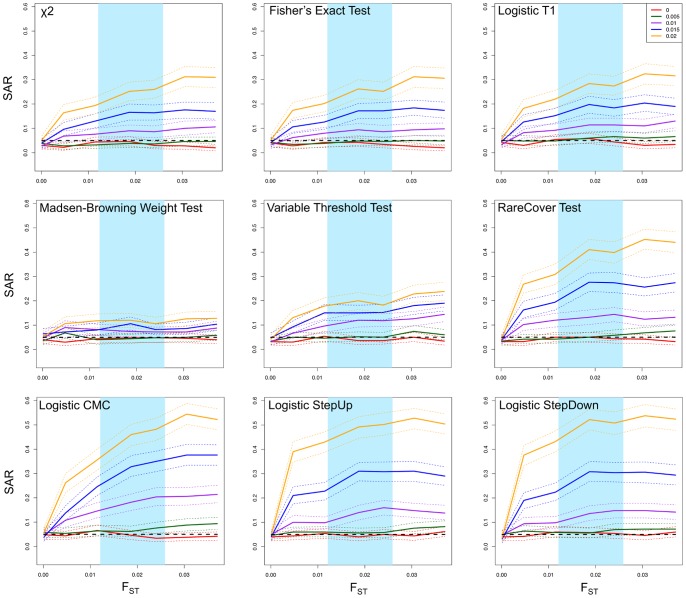
Figure 4. SAR of rare variant association methods as a function of FST .
. We tested for spurious association rates at various divergence times, presented as FST estimates for comparison with European populations in HGDP (light blue shading). The various lines represent differences in disease risk according to the equations P(d = c|i = 1) = 0.02+ X and P(d = c|i = 2) = 0.02 − X. The dashed black line represents the α = 0.05 value used to determine significance and the dotted lines represent the 95% confidence intervals calculated by bootstrapping.

