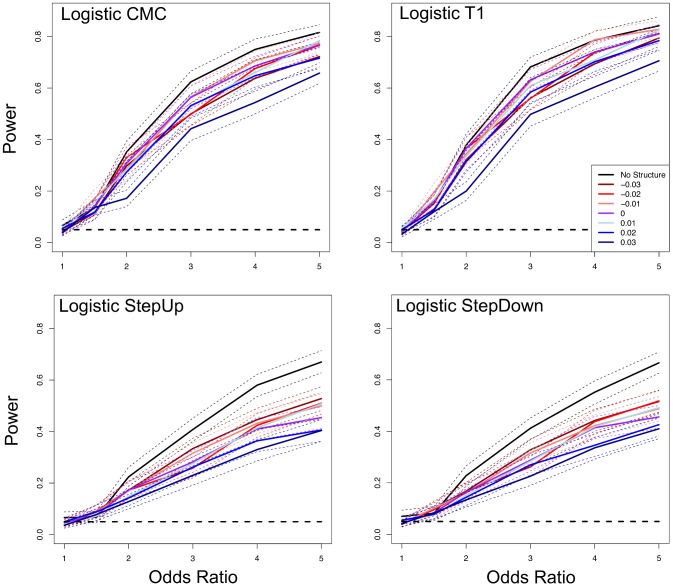
Figure 5. Correcting for population structure reduces the power of rare variant association methods.
The figure shows the power of logistic regression methods when including ten PC covariates. The x-axis shows the odds ratio (OR), where 1.0 is the null model. “No Structure” indicates simulations where power was estimated from sampling cases and controls from a single panmictic population, but still corrected for structure. The dashed black line represents α = 0.05 and the dotted lines represent the 95% bootstrap confidence intervals.

