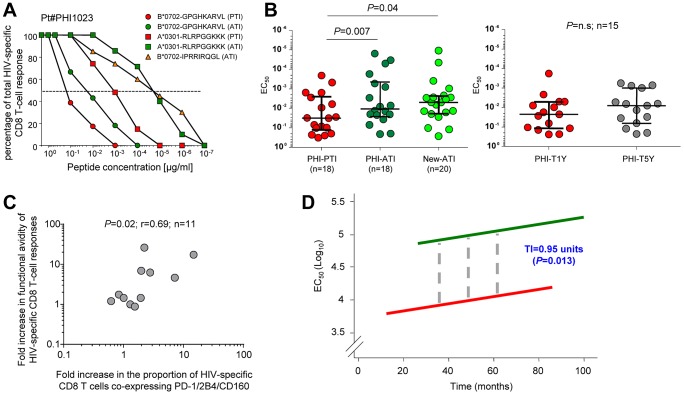
Figure 6. Increase in functional avidity of HIV-specific CD8 T cells following treatment interruption.
A. Functional avidity of B*0702-GPGHKARVL- and A*0301-RLRPGGKKK-specific CD8 T cells from patient #1023 before (-PTI) and after (-ATI) treatment interruption (TI) and analysis of the functional avidity of B*0702-IPRRIRQG-specific CD8 T-cell response, which was undetectable before TI. B. Cumulative matched-paired analysis of the functional avidity of HIV-specific CD8 T-cell responses in patients treated during acute HIV infection (PHI) before (-PTI) or after treatment interruption (-ATI) and in PHI patients after 1 (-T1Y) or 5 years (-T5Y) of uninterrupted ART. Twenty new HIV-specific CD8 T-cell responses generated ATI (New-ATI) within the same patients are also shown. C. Association between the fold increase in avidity of HIV-specific CD8 T-cell responses and the fold increase in the proportion of HIV-specific CD8 T cells co-expressing PD-1, 2B4 and CD160. D. Mixed-effect linear models were used to assess the evolution of functional avidity as a function of time and virus rebound, as detailed in the Methods. Solid lines represent the lack of significant increase in avidity overtime in patient ON (red line) or OFF (green line) ART, whereas the dashed lines represent the immediate increase of functional avidity occurring after treatment interruption.

