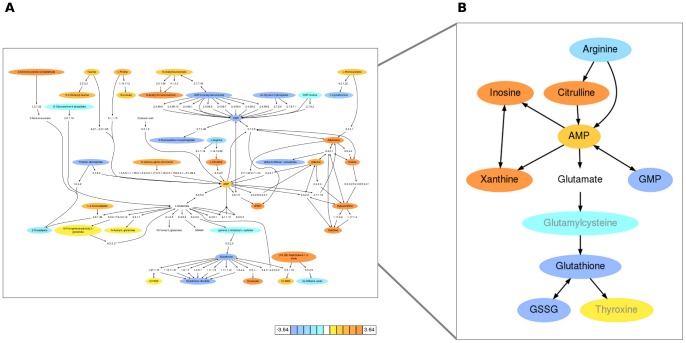
Figure 3. Metabolic activity network in dendritic cells stimulated by yellow fever virus.
A) Prediction by mummichog directly from m/z feature tables (cell extracts after 6 hours of infection). Metabolites are colored according to log2 fold change. A high resolution copy is given in Figure S9. B) Further investigation was focused on the subnetwork on the right. Glutamate was not significantly altered, but included for network connectivity.

