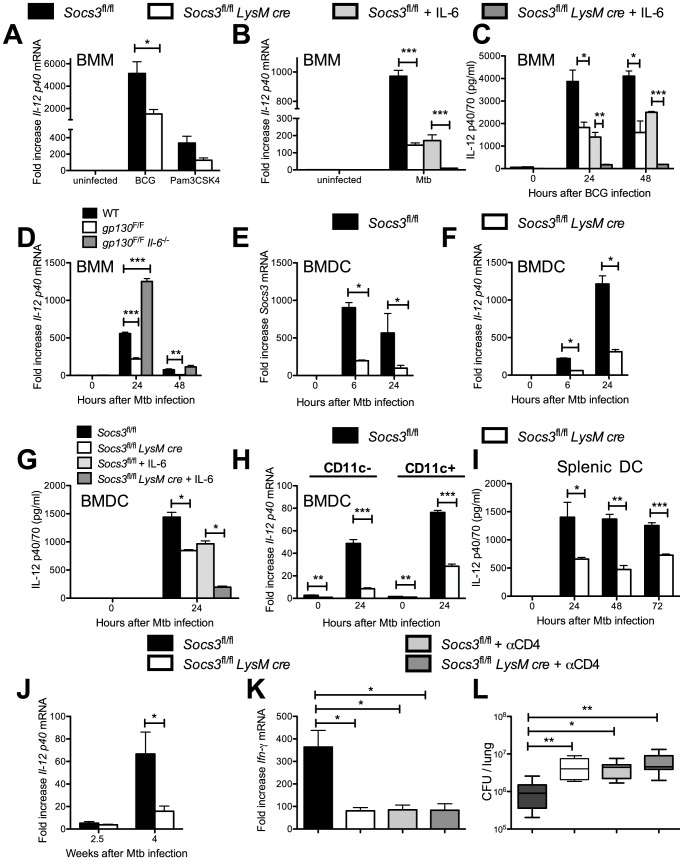
Figure 4. Reduced IL-12 secretion in Socs3fl/fl LysM cre macrophages and DCs after mycobacterial infection.
The levels of Il-12 p40 mRNA were measured in triplicate cultures of Socs3fl/fl LysM cre and Socs3fl/fl BMM infected with BCG (A) or M. tuberculosis (B) or treated with Pam3CSK4 for 24 h (A). Additionally, 50 ng/ml recombinant IL-6 was added to M. tuberculosis-infected samples (B). One out of two independent experiments is shown (*p<0.05 and ***p<0.001 Student t test). The concentration of IL-12 in supernatants from BCG-infected Socs3fl/fl and Socs3fl/fl LysM cre BMM co-incubated with 50 ng/ml IL-6 was determined by ELISA (C). The mean IL-12 concentration ± SEM from triplicate cultures per condition in one of two independent experiments is depicted, (*p<0.05, **p<0.01, ***p<0.001 Student t test). The levels of Il-12 p40 mRNA were measured in triplicate cultures of gp130F/F, gp130F/F Il-6−/− or WT BMM infected with M. tuberculosis (D), (**p<0.05 and ***p<0.001 Student t test). The levels of Socs3 (E) and Il-12 p40 mRNA (F) in triplicate cultures of M. tuberculosis-infected Socs3fl/fl LysM cre and Socs3fl/fl BMDC were determined by real time PCR. One of two independent experiments is shown, (*p<0.05 Student t test). The concentration of IL-12 was determined by ELISA in supernatants from triplicate cultures of M. tuberculosis-infected Socs3fl/fl LysM cre and Socs3fl/fl BMDC co-incubated or not with 50 ng/ml IL-6 (G), (*p<0.05, Student t test). Total RNA was extracted from M. tuberculosis-infected CD11c+ and CD11c- Socs3fl/fl and Socs3fl/fl LysM cre BMDC cultures 24 h after M. tuberculosis infection. The mean Il-12p40 mRNA levels ± SEM levels measured by real time PCR are depicted (H). The concentration of IL-12p40 in supernatants from M. tuberculosis-infected Socs3fl/fl and Socs3fl/fl LysM cre splenic DCs was determined by ELISA (I). The mean IL-12p40 ± SEM pg/ml from triplicate cultures is depicted (*p<0.05, **p<0.01, ***p<0.001 Student t test). The fold increase of Il-12 p40 mRNA in the lungs of M. tuberculosis-infected Socs3fl/fl LysM cre and Socs3fl/fl mice relative to uninfected mice is displayed (J). The data is pooled from 2 independent experiments with n≥5 animals per group in each one (*p<0.05, Student t test). Total RNA was isolated from the lungs of Socs3fl/fl LysM cre and Socs3fl/fl mice (n≥7 per group) treated or not with CD4 cell-depleting antibodies 2.5 weeks after infection with M. tuberculosis (K). The mean Ifn-γ mRNA ± SEM is depicted, (*p<0.05, Student t test). Bacterial loads in lungs from Socs3fl/fl and CD4+ cell-depleted Socs3fl/fl and Socs3fl/fl LysM cre mice (n≥5) 2.5 weeks after M. tuberculosis infection are shown (L). A box and whisker diagram showing the median CFU, quartiles and the 99th percentiles is depicted, (*p<0.05, **p<0.01 Mann Whitney U test).

