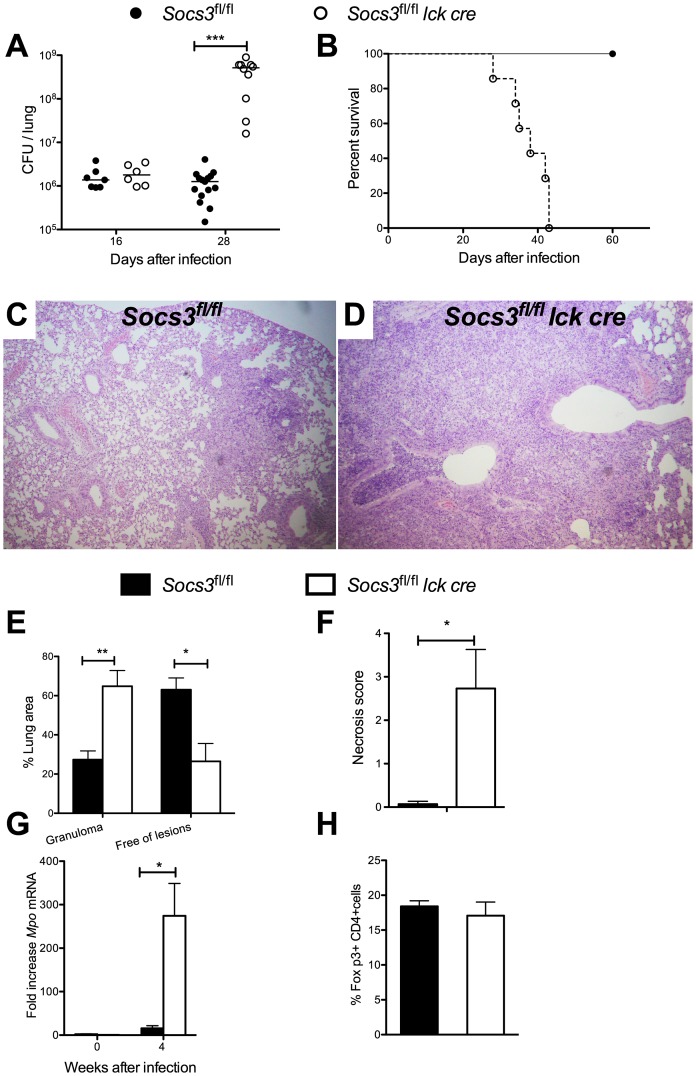
Figure 5. Mice with SOCS3-deficient T cells are susceptible to infection with M. tuberculosis.
Socs3fl/fl lck cre and Socs3fl/fl mice were sacrificed at the indicated time points after aerosol infection with M. tuberculosis, and CFU in lungs assessed (A). The CFU per lung of individual mice and the median per group (n≥5) are depicted. Results are pooled from three independent experiments. Differences in CFU are significant (***p<0.001 Mann Whitney U test). The cumulative mortality of Socs3fl/fl lck cre and Socs3fl/fl mice (n = 10 mice per group) after aerosol infection with M. tuberculosis is depicted (B). Differences in survival curves are significant (Log-rank test p<0.0005) with a median survival of 38 days for Socs3fl/fl lck cre mice. Hematoxylin-eosin stained paraffin lung sections from Socs3fl/fl (C) and Socs3fl/fl lck cre mice (D) and their histopathological scoring (E, F) determined 4 weeks after infection with M. tuberculosis. The mean % lung area with granulomas or free of lesions ± SEM and the mean score of lymphocytes within the granuloma or in perivascular spaces ± SEM is shown (F). Differences with controls are significant (n = 5 per group, *p<0.05 Student t test). Socs3fl/fl lck cre and Socs3fl/fl mice were sacrificed 4 weeks after M. tuberculosis infection and the total RNA was extracted from lungs. The accumulation of Mpo and Hprt transcripts was measured by real time PCR (G). The mean fold increase of Mpo mRNA ± SEM in lungs from infected mice (n≥5 per group) was calculated. Differences with infected Socs3fl/fl mice are significant (*p<0.05 Student t test). The mean frequency of FoxP3+ within CD4+ pulmonary lymph node CD3+ T cells from Socs3fl/fl lck cre and Socs3fl/fl mice (n = 5 per group) was determined by FACS analysis 4 weeks after infection with M. tuberculosis (H).

