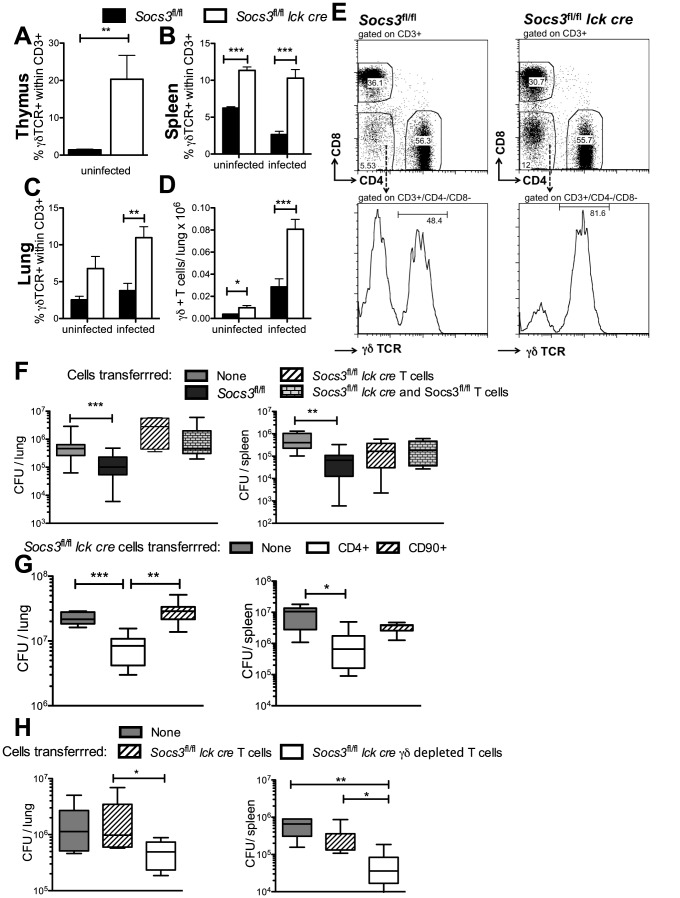
Figure 6. γδ+ T cell numbers are increased in organs of Socs3fl/fl lck cre mice.
The frequency of γδ+ T cells within CD3+ cells in the thymus (A), spleen (B) and lung (C) of Socs3fl/fl lck cre and Socs3fl/fl mice obtained before or 2.5 weeks after M. tuberculosis infection were determined by FACS. Mean percentage (A–C) and the total numbers (D) of γδ+ within CD3+ T cells in the lungs ± SEM are depicted. Differences with Socs3fl/fl mice (n = 4 per group) are significant (*p<0.05, ***p<0.001 Student t test). The gating strategy and representative dot-plots for spleens of infected Socs3fl/fl lck cre and Socs3fl/fl mice are shown (E). Two million Socs3fl/fl lck cre or Socs3fl/fl CD90+ T cells positively selected from spleens using magnetic beads were inoculated i.v. into Rag1−/− mice. A group of animals was also inoculated with both Socs3fl/fl lck cre and Socs3fl/fl T cells (F). Rag1−/− mice were alternatively transferred with 1.2×10⁶ CD4+ or 2×10⁶ CD90+ Socs3fl/fl lck cre spleen cells (G) or in a different experiment with 2×10⁶ FACS-sorted CD3+ depleted of γδ+ T cells or total CD3+ Socs3fl/fl lck cre spleen cells (H). Two weeks after transfer, mice were infected with M. tuberculosis via the aerosol route. Mice (n≥6 per group) were sacrificed 4 weeks after infection. Box and whisker diagrams showing the median CFU, quartiles and the 99th percentiles in lungs and spleens are depicted (F–H). Differences in CFU are significant (*p<0.05, **p<0.001, ***p<0.001 Mann Whitney U test).

