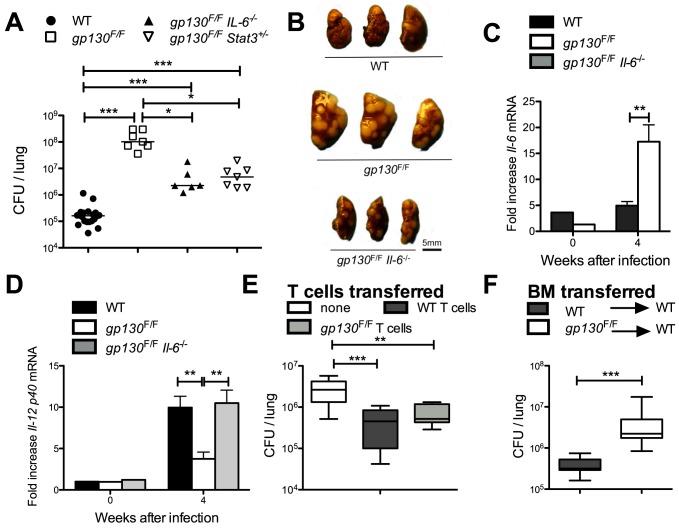
Figure 9. Gp130F/F mice display dramatic susceptibility to infection with M. tuberculosis.
Gp130F/F, gp130F/F Il-6−/−, gp130F/F/Stat3+/− and control mice were sacrificed 4 weeks after aerosol infection with M. tuberculosis, and CFU per lung assessed (A). The CFU in lungs of individual mice and the median per group (n≥6) are depicted. Results are pooled from two independent experiments. Differences in CFU are significant (*p<0.05, ***p<0.001 Mann Whitney U test). A gross-pathology photograph of the lungs from gp130F/F, gp130F/F Il-6−/− and control mice 4 weeks after infection with M. tuberculosis is shown (B). Gp130F/F, gp130F/F Il-6−/− and control mice were sacrificed at 4 weeks after M. tuberculosis infection and the total RNA was extracted from lungs. The accumulation of Il-6 (C) and Il-12 p40 (D) transcripts was measured by real time PCR. The mean fold cytokine mRNA increase ± SEM in lungs from infected mice (n = 5 per group) are depicted. Differences with controls are significant (**p<0.01 Student t test). 2×10⁶ CD90+ gp130F/F and control splenic T cells were inoculated i.v. into Rag1−/− mice. Two weeks after transfer, mice were infected via the aerosol route with M. tuberculosis. Mice were sacrificed 4 weeks after infection and the CFU in lungs determined. The median CFU (n≥10) in lungs, quartiles and the 99th percentiles are depicted (E). Results are pooled from two independent experiments. Differences in CFU are significant (**p<0.01, ***p<0.001 Mann Whitney U test). The CFU in lungs of gp130F/F bone marrow→WT and WT bone marrow→ WT radiation chimeric mice were measured one month after infection with M. tuberculosis. A box and whisker diagram showing the median CFU (n≥8), quartiles and the 99th percentiles is depicted (F). Differences in CFU are significant (***p<0.001 Mann Whitney U test).

