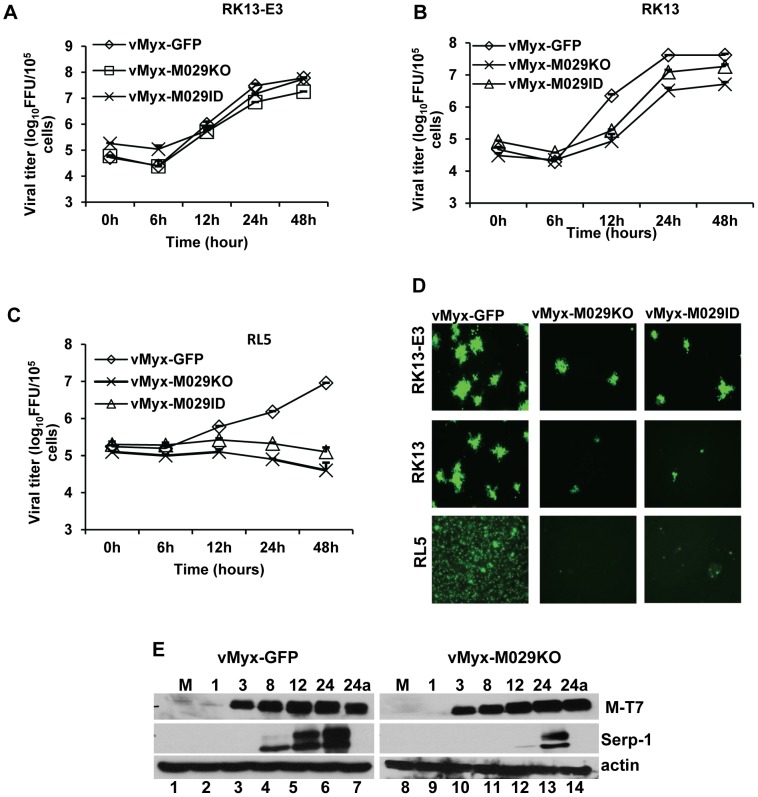
Figure 2. M029 is required for optimal MYXV replication in rabbit cells.
Single step growth curves of MYXV infection in A) RK13-E3, B) RK13 and C) RL5 T lymphocytes. The indicated cells were infected with vMyx-GFP, vMyx-M029KO or vMyx-M029ID at an MOI of 5, and then cells were collected at 0, 6, 12, 24, and 48 h p.i. The virus titers were determined in triplicate following serial dilution onto RK13-E3 cells. Data are representative of two independent experiments. D) Fluorescence microscope images of infected RK13-E3 (top panels), RK13 (middle panels) and RL5 (bottom panels) cells. The images were taken using an inverted fluorescence microscope using a lens with ×10 magnification at 48 h p.i. The cells were infected at an MOI of 0.05 for RK13-E3 and RK13 and an MOI of 3 for RL5 with vMyx-GFP (left column), vMyx-M029KO (middle column) and vMyx-M029ID (right column). E) Expression of viral early (M-T7) and late (Serp-1) proteins in the infected RK13 cells. RK13 cells were left uninfected (M) (lanes 1 and 8) or were infected with vMyxGFP (lanes 2 to 7) or vMyx-M029KO (lanes 9 to 14) at an MOI of 3. Cells were collected at 1 (lanes 2 and 9), 3 (lanes 3 and 10), 8 (lanes 4 and 11), 12 (lanes 5 and 12), 24 (lanes 6 and 13) and 24a in the presence of AraC (lanes 7 and 14) h p.i. The membranes were first probed with anti-Serp-1 antibody, stripped and probed for M-T7 and actin (loading control).

