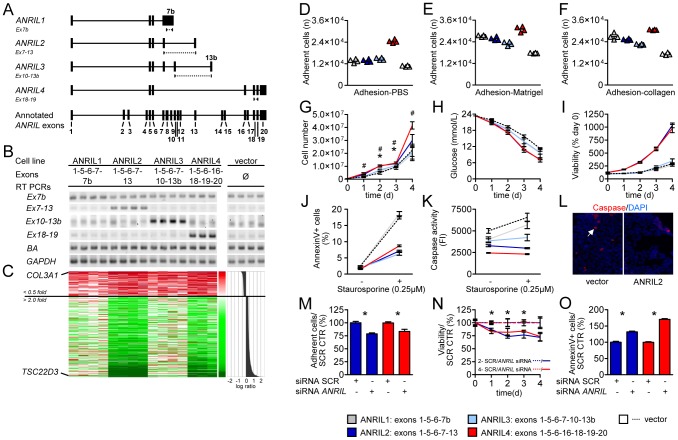
Figure 2. ANRIL regulates gene expression in trans and affects cell adhesion, metabolic activity, proliferation, and apoptosis.
(A) Consensus transcripts of 4 ANRIL isoform groups identified by RACE and PCR (Figure S1). Dotted lines indicate positions of transcript-specific qRT-PCR assays. (B) RT-PCR confirmation of ANRIL over-expression in stable ANRIL1-4 cell lines. 3–4 cell lines per ANRIL isoform were established, no effect on house-keeping gene expression was found (beta-actin (BA); glyceraldehyde-3-phosphate dehydrogenase (GAPDH)). (C) Heatmap of ANRIL trans-regulated transcripts corresponding to panel B. Transcripts with average down- (<0.5-fold, red) and up- (>2-fold, green) regulation relative to vector control are shown. (D–F) Adhesion of ANRIL over-expressing cell lines to PBS-, Matrigel-, and collagen-coated wells (P<0.01 for comparison of ANRIL1, 2, 3, 4 vs. vector control). (G–I) Cell proliferation and metabolic activity determined by (G) absolute cell numbers, (*/# P<0.05 for ANRIL2 and ANRIL4 vs. vector control), (H) glucose utilisation, and (I) viability assay. (J–L) Apoptosis determined by (J) AnnexinV-positive cells, (K) caspase activity, and (L) caspase-3 staining. (H–K) P<0.05 for ANRIL2 and ANRIL4 vs. vector control. (M–O) Reversal of effects by RNAi against ANRIL (*P<0.05; SCR- scrambled control). (D–K) At least triplicate measurements per pool of 3–4 biological replicates were performed. For details on experimental setup and P-values please see Table S3. (M–O) n = 3/group. Validation of siRNA knock-down is shown in Figure S6. Error bars indicate s.e.m.

