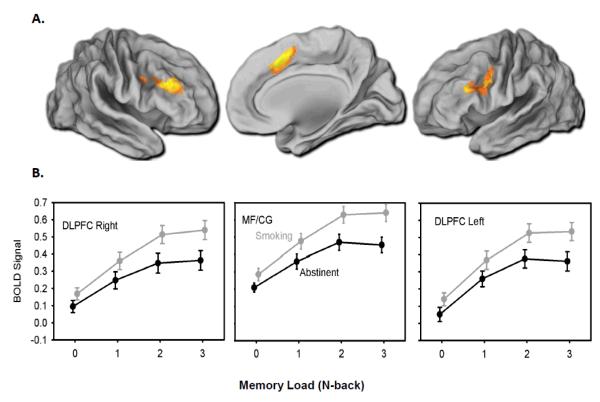
Figure 1. BOLD signal change by session and memory load.
A) Colored regions represent functionally defined ROI masks identified using a whole brain repeated measures ANOVA with a voxel threshold of p<0.0001 and cluster corrected at Z = 6.03. Mean percent signal change was extracted from the ROIs for offline analysis of abstinence effects. B) Mean percent BOLD signal change from baseline extracted at each memory load during abstinent and smoking sessions; means are presented as raw values (unadjusted for covariates) and bars represent standard error (n=63). In the multiple regression models, percent signal change from baseline was significantly reduced during abstinence in the MF/CG and right and left DLPFC (all ps < 0.001). MF/CG = medial frontal/cingulate cortex, DLPFC = dorsolateral prefrontal cortex

