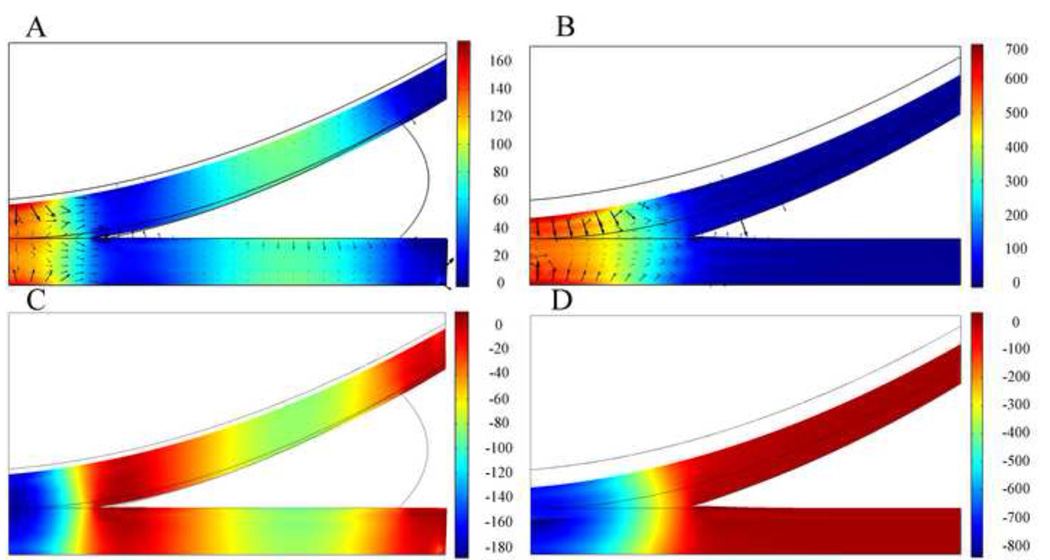
Fig. 6.
Distribution of fluid pressure p, in kPa at t=1s on deformed geometry of cartilages in the knee models with meniscus (A) and without meniscus (B). Black arrows are fluid flow vectors. Distribution of total normal stress , in kPa at t=1s on deformed geometry of cartilages in the knee models with meniscus (C) and without meniscus (D). The peak force applied to these two models was 73.5N. Grey boundary lines are initial position.

