
Fig. 1.
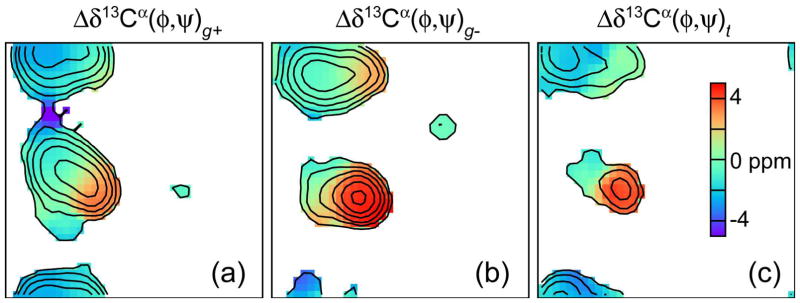
Average (φ,ψ)-dependence of the Δδ13Cα chemical shift in Thr for three different χ1 rotameric states: (a) g+; (b) g−; and (c) t, displayed as Ramachandran maps. Only regions with a residue density (for definition see (Spera and Bax 1991)) larger than one are color coded. The residue density is marked by gray contour lines, increasing from 1 with an increment factor of 3.2. The average secondary chemical shifts for residues in the α regions are 0.6±2.0, 3.9±1.7 and 2.0±−2.4 ppm, for χ1 rotameric states of g+, g− and t, respectively, and −2.2±1.2, −0.2±1.4, and −2.2±1.5 ppm, respectively, for residues in the β region.