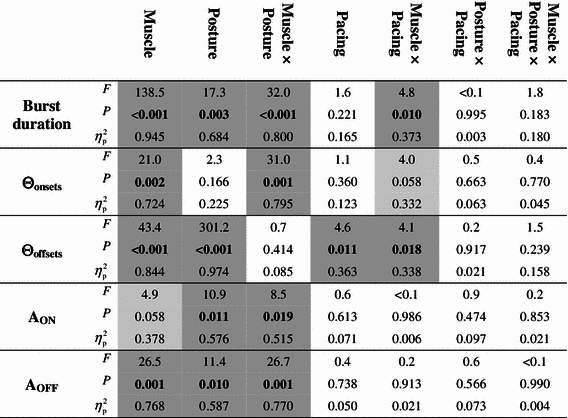
Table 2.
Statistics of main and interaction effects for EMG measures

|
Significant (P < 0.05) and two near significant effects (P = 0.058) are highlighted in dark and bright gray, respectively
Statistics of main and interaction effects for EMG measures

|
Significant (P < 0.05) and two near significant effects (P = 0.058) are highlighted in dark and bright gray, respectively