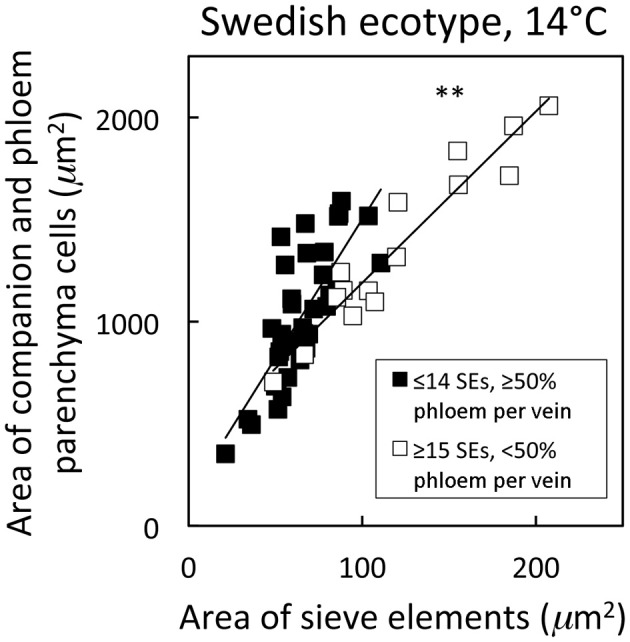
Figure 6.

Relationship between the cross-sectional area of companion and phloem parenchyma cells associated with sieve elements and the area of sieve elements for individual second-, third-, and fourth-order veins from the A. thaliana Swedish ecotype grown at 14°C under 400 μmol photons m−2 s−1. Individual veins (n = 52) were segregated by sieve element (SE) number and ratio of phloem area/vein area into veins containing ≤14 SEs and phloem area/vein area ≥0.5 (black squares; putative minor loading veins) or ≥15 SEs and phloem area/vein area <0.5 (open squares; second order veins). Linear regression lines drawn for each segregated group of veins (≤14 SEs or ≥15 SEs), and statistically significant differences in slope and intercept (ANCOVA) between regression lines is indicated (** = P < 0.01). Linear regression analyses for each line are y = 13.6 x + 142, R2 = 0.60, and P < 0.001 (black squares) and y = 8.4 x + 351, R2 = 0.91, and P < 0.001 (open squares).
