
Fig. 10. Separable features between phoneme articulation on the microscale.
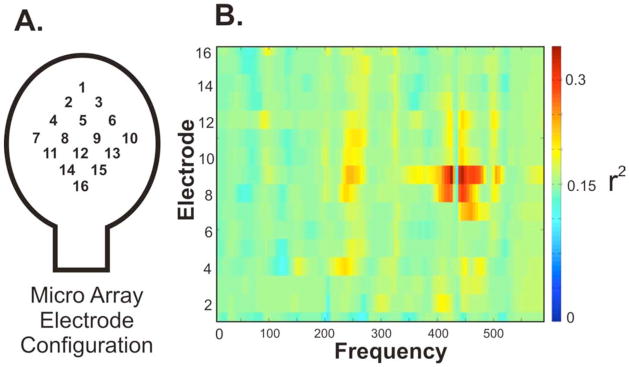
Data taken from Subject 2. (A) Electrode configuration of micro electrode array. (B) Feature plot demonstrating the very local high frequency change that was distinct between overt articulation of “oo” and “ah.” Statistics were calculated using spectral estimates from 24 trials of each phoneme.