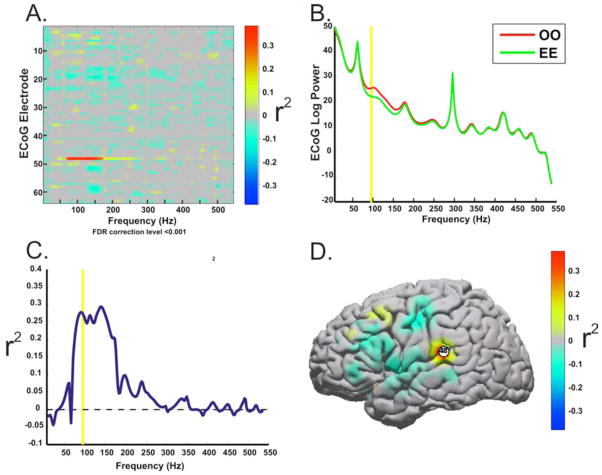
Fig. 2. Screening for Control Features.
Patients underwent initial screening to identify control features for use in subsequent closed-loop control experiments. Exemplar data from Patient 1 illustrates the screening process. The screening data was converted to the frequency domain by autoregressive spectral estimation. This exemplar feature plot (A) shows the r2 values between trials when the patient spoke the phonemes “oo” and “ee” for 25 trials of each. For each electrode and frequency bin,the significant task related spectral power increases or decreases were identified by calculating the r2 value between the baseline spectra and the activity spectra for each of phoneme speech tasks and between the phonemes. Note that the greatest contrast occurs on electrode 48 between 75–175Hz. Those ECoG features (i.e., particular electrodes and frequency bins) with the most substantive changes in power (B) that accounted for a significant amount of the variance between the tasks [as indicated by their relatively higher r2 values(C)], were chosen as potential control features for the subsequent closed loop control experiments. (D) The anatomic distribution of r2 values for the control frequencies (75–100Hz). The location of ECoG features used for BCI control was constrained to perisylvian areas involved in the speech network.

