
Fig. 5. Cortical Activation During Real and Imagined Phoneme Articulation.
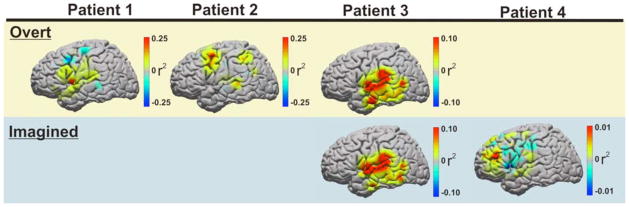
Topographic distribution of cortical activation for each patient as represented by statistically significant (p < 0.001) r2 values increases in classic high gamma frequency amplitudes (75–100Hz) during real and imagined speech articulation. Yellow row represents topographic distribution of cortical activation associated with overt articulation screening (patients 1–3). Blue row represents topographic distribution of cortical activation associated with imagined articulation screening (patients 3 & 4).