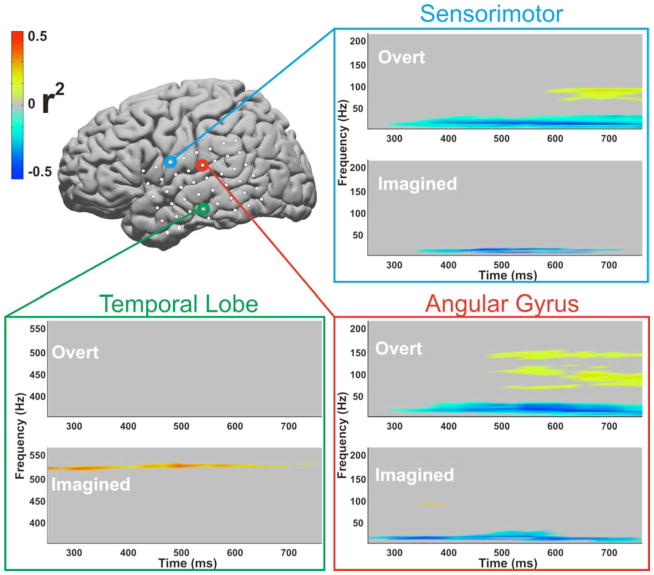
Fig. 7. Difference between real and imagined speech.
Time frequency plots from three exemplar electrodes (Patient 3, sensorimotor cortex, angular gyrus, and the temporal lobe) that demonstrate substantial differences in power modulation depending on whether overt or imagined speech screening was performed. Time zero indicates the time when the visual cue for a phoneme was presented. Significant power modulation was thresholded to a p-value < 0.05. Only power modulations surpassing that threshold are shown. Statistics were calculated over 160 trials for overt speech and 99 trials for imagined speech.

