
Fig. 9. Separable features between phoneme articulation.
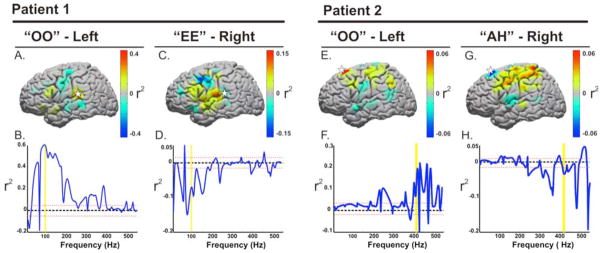
Data taken from Subjects 1 and 2 who demonstrated significant spectral and anatomic differences in phoneme articulation. For Patient 1, A & C, demonstrate the variable cortical topographies of activation that are different between imagined “oo” and “ee.” (B and D) represent the associated variance of the power change (r2) associated with the two conditions compared to rest across spectral estimates from 25 trials of each phoneme (positively or negatively weighted depending on the increase or decrease of power, respectively). The power increase at 95 Hz was used to drive the cursor to the left, while the power decrease associated with “ee” drove the cursor to the right. Similarly, the large scale spectral topographies were separable for Patient 2 (E and G). The control features shown in F and H, however, were taken from dorsal premotor cortex recorded with a microgrid array (shown in Figure 10). Statistics were calculated using spectral estimates from 24 trials of each phoneme. The dotted red line represents a p-value cutoff of p <0.001 for the r2 values displayed.