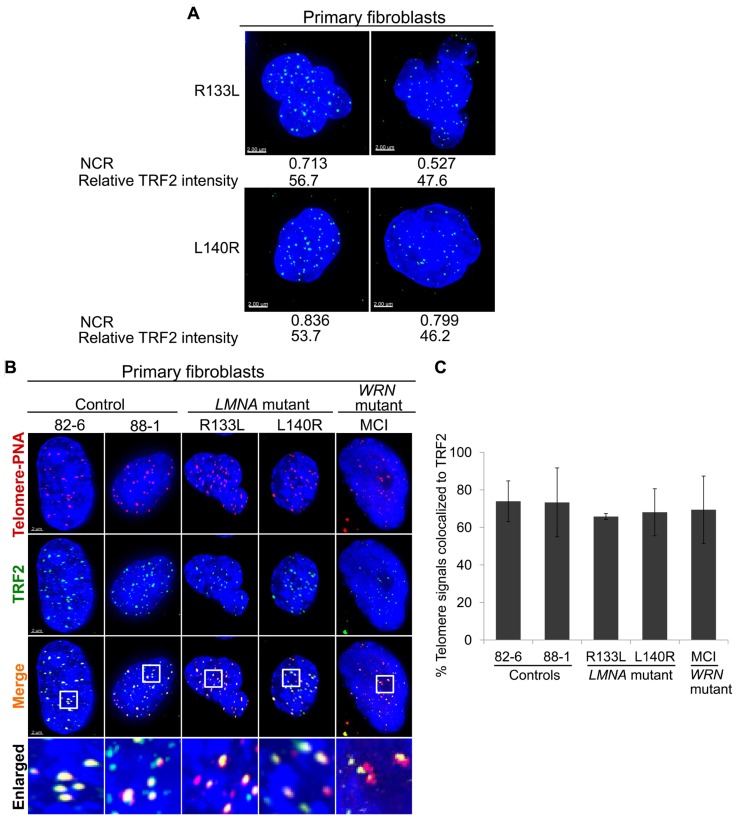
FIGURE 2.
Intranuclear localization ofTRF2 in primary fibroblasts. (A) Abnormal nuclear morphology as measured via NCR and TRF2 expression (green) in LMNA mutant cells. (B) Immuno-FISH staining of telomeres (using a telomeric PNA probe; red), TRF2 (green) and DNA (using DAPI; blue) in control, LMNA and WRN mutant cells. White boxes in the merged images indicate areas that are enlarged 5× and shown to the bottom. Scale bar: 2 μm. (C) Fractions of telomeric DNA co-localized to TRF2. Data were presented as means ± s.d. Approximately 70 cells were analyzed for each cell line.

