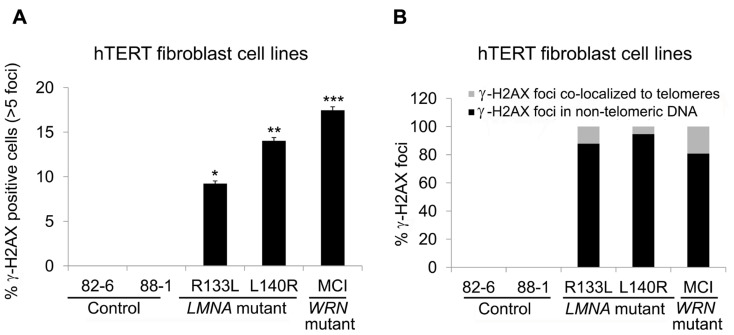
FIGURE 5.
Detection of γ-H2AX foci in control and LMNA mutant fibroblasts expressing hTERT. (A) Percentage of cells with >5 γ-H2AX-labeled foci, as stated in Figure 3. *P < 0.05, **P < 0.005, ***P < 0.001. (B) Quantitation of γ-H2AX foci in indicated cell lines. Signals co-localizing TRF2 (gray) and those not co-localizing (black) are separately shown. In each condition approximately 70 cells were analyzed for each cell lines.

