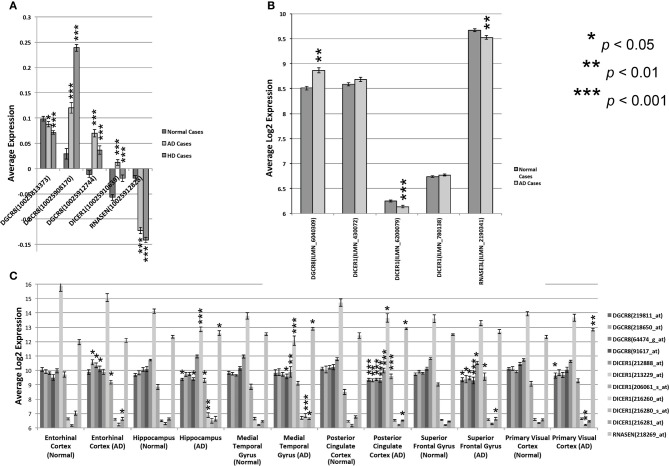
Figure 4.
Expression of miRNA biogenesis genes across human cases. Expression of multiple DICER, DROSHA, and PASHA probe sets from different regions of normal and diseased human brain tissue. (A) Expression levels are shown for the three miRNA biogenesis genes in the prefrontal cortex of normal or Alzheimer (AD) or Huntington Disease (HD) cases (HBTRC data). The average expression ratio of each gene in normal, AD, and HD cases compared to a common reference sample is shown on the Y-axis. (B) Average log2 expression (Y-axis) of DICER, PASHA, and DROSHA is shown for the Neocortex of normal or AD patients. Expression data was standardized to have an average log2 expression of 8 with a standard deviation of ± 2. (C) Average log2 expression of all three genes, as assayed by different probe sets, is shown on the Y-axis for 6 different brain regions from normal and AD cases. Expression data was standardized to have an average log2 expression of 8 with a standard deviation of ± 2. Significant expression differences are often observed for at least one probe set between normal and Alzheimer or Huntington Disease cases. Significance was determined by Student's two-tailed t-test.

