Figure 5.
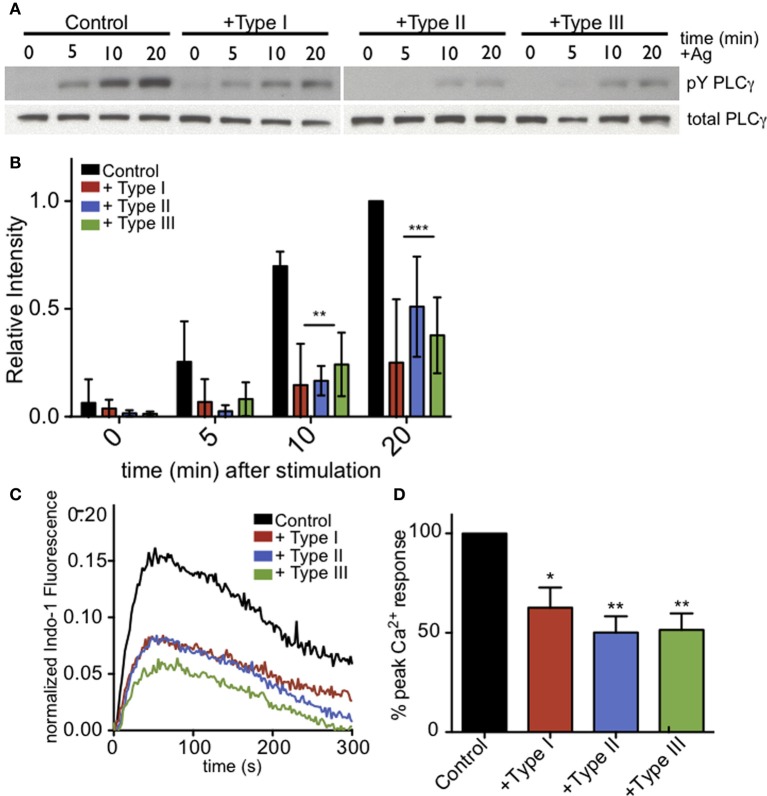
PLCγ2 activity is reduced in T. gondii-infected RBL-2H3 cells. (A) Representative western blot of phospho-PLCγ2 (top) or total PLCγ2 (bottom) in control or type I-,II- or III-infected (MOI 10:1, 1 h) cells lysed at 0, 5, 10, or 20 min after addition of multivalent antigen (10 ng/ml DNP-BSA). (B) Quantification of phospho-PLCγ2 analysis as shown in (A). Error bars represent SD of 4 independent experiments (**P < 0.01,***P < 0.001, and ****P < 0.0001 relative to uninfected cells). (C) Representative indo-1 fluorescence measurements of Ca2+ responses to 10 ng/ml DNP-BSA in the absence of extracellular Ca2+ in control uninfected (black), Type I-infected (red), Type II-infected (blue) or Type III-infected (green) cells (MOI 10:1). (D) Peak Ca2+ responses in infected cells as a percentage of control Ca2+ response of uninfected cells in the absence of extracellular Ca2+. Histogram shows averages of 3 independent experiments. Error bars represent SEM (*P < 0.05 and **P < 0.01 relative to control cells).

