Figure 10.
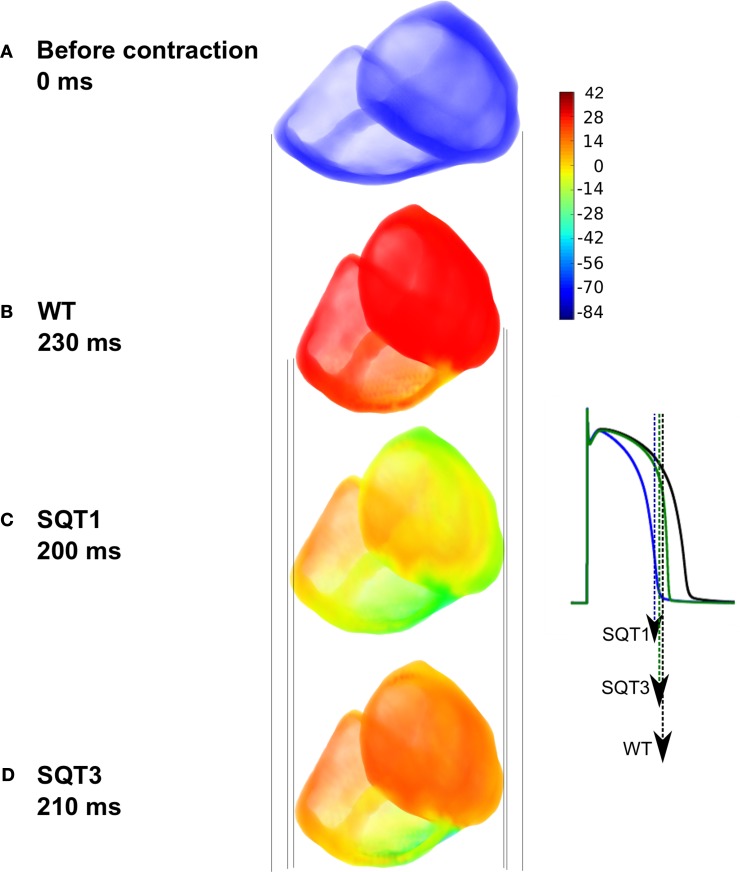
Electromechanical coupling in 3D ventricle model under the SQT1 and SQT3 mutations with Isac. (A) Resting position of the ventricles prior to electrical stimulation. (B) Snapshot of maximum deformation occurring at 230 ms under the WT condition just at the onset of repolarization (black AP). (C) Snapshot of maximum deformation occurring at 200 ms under the SQT1 condition. Repolarization is already significantly advanced (blue AP). (D) Snapshot of maximum deformation occurring at 210 ms under the SQT3 condition. Repolarization is already in progress (green AP). Vertical lines show a comparison of the degree of contraction of the ventricles between the different conditions. Color bar represents the membrane potentials of cells in the ventricles ranging from –86 to 42 mV. The APs shown in the inset are from a left ventricular cell under the WT, SQT1 and SQT3 conditions. Arrows indicate the snapshot time shown in the main figure for each condition corresponding to the repolarization time at which maximal deformation occurs.

