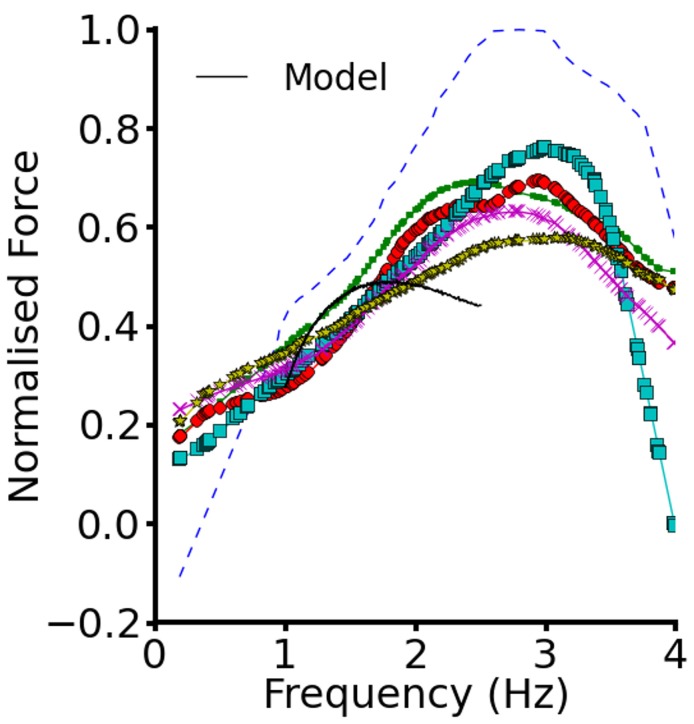
Figure 2.
Force-frequency relationship. Plot of steady state normalized active force vs. heart rate using the EPI cell model. Black continuous line represents the WT electromechanics model while symbols represent experimental data from non-failing control preprarations of human myocardium. Experimental data from Mulieri et al. (1992).

