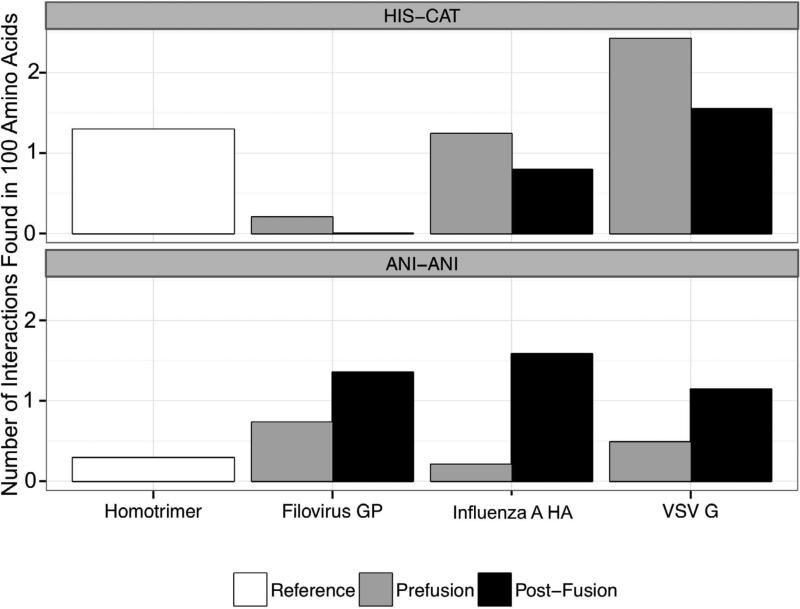
Figure 3. Histogram of median interactions in viral proteins and in reference data sets.
Using Rosetta Scientific Benchmarking ChargeCharge feature reporter, we catalogued the number of HisCat and AniAni interactions in both the pre- and post- fusion states of HA, VSV-G, and GP. The virus data set includes the following PDBs, HA prefusion (clade) 1JSD (H9), 1JSM (H5), 1RU7 (H1), 1RUY (H1), 1RVT (H1), 1RUZ (H1), 2WRH (H1), 3EYJ (H1), 3HTO (H1), 3KU3 (H2), 3LZG (H1), 3M5G (H7), 3QQB (H2), 3S11 (H5), 3SDY (H3), 3VUN (H3), 4F23 (H16), 4FNK (H3), 2YP7 (H3), influenza post-fusion 1HTM, VSV-G prefusion 2J6J biological assembly, VSV-G post-fusion 2CMZ, GP prefusion 3CSY, GP post-fusion 2EBO, 4G2K. All ligands and other proteins were removed from these PDBs prior to analysis. We analyzed a reference homotrimer dataset for comparison. The distance cutoff for HisCat and AniAni interactions were 6.5Å and 4Å respectively, and the number of interactions was normalized per 100 amino acids.

