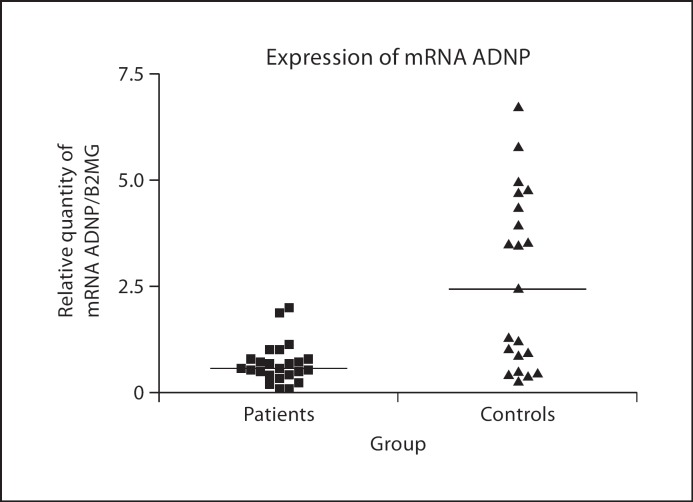
Fig. 1.
Expression of ADNP mRNA in peripheral blood of MS patients (n = 24) versus age- and gender-matched control subjects (n = 21). Results represent individual arbitrary units of ADNP mRNA normalised to β-2 microglobulin mRNA. The horizontal lines represent medians. The expression in controls was significantly higher than in MS patients (p < 0.001).

